As healthcare data integrations become more dynamic, composable, and conditional, the tools used to understand them need to evolve too, a shift reflected in Redox’s platform expansion announced last fall.
Introducing Workflow Viewer – a new way to understand how data actually moves through your system that goes beyond static, text-based logs.
The problem with “reading” your integrations
Anyone who has tried to debug an issue in a complex healthcare data workflow recognizes the pattern. You start with logs, scroll through events, click into individual steps, and try to piece together what happened. At some point, you stop reading and start reconstructing the system manually.
This gets more and more challenging (and frustrating) as workflows become more sophisticated. Features like conditional routing, batch splitting, custom logic, and multi-hop data journeys have become increasingly central to how real-world healthcare data workflows operate.
For example, a single workflow might ingest real-time clinical data from an EHR, enrich it with context from an HIE, normalize everything to FHIR, and bundle it into a unified payload. That payload could then be sent to an LLM to generate a clinical summary, with the result routed back into the EHR for clinician use.
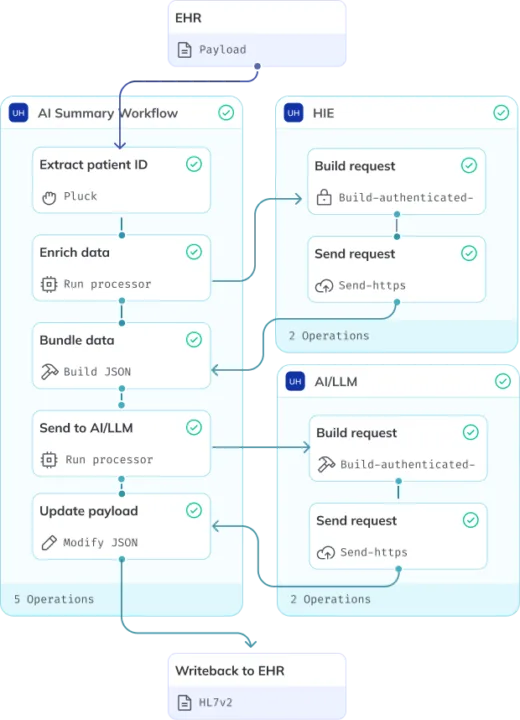
Figure 1. Clinical record enrichment & summarization (LLM) workflow: Automate the generation of longitudinal patient summaries by merging real-time EHR data with external HIE context, providing LLMs with the full clinical picture.
Or another workflow might split inbound data into multiple paths based on event type, apply distinct transformations or validations in parallel, and route outputs to different downstream systems according to business logic.
As workflows like these become more common (explore more examples in this composable workflow library), the limits of a flat, log-based view become obvious.
A visual layer on top of your logs
With Workflow Viewer, you can see a complete, end-to-end map of an executed workflow in the Redox Dashboard. Each step is part of a connected flow, making relationships, dependencies, and transformations immediately visible in the dashboard.
Processor blocks aren’t just visual markers, they’re interactive. Click into any step to open a detailed pane with deeper context without losing your place in the workflow. At the same time, sections of the workflow can be quickly collapsed or expanded, making it easier to scan high-level structure or focus on specific areas.
This fundamentally changes how quickly teams can understand their workflows. Less-technical users can follow the path of a message without needing to interpret logs, while more technical users can audit logic faster because the structure is already clearly laid out and explorable.
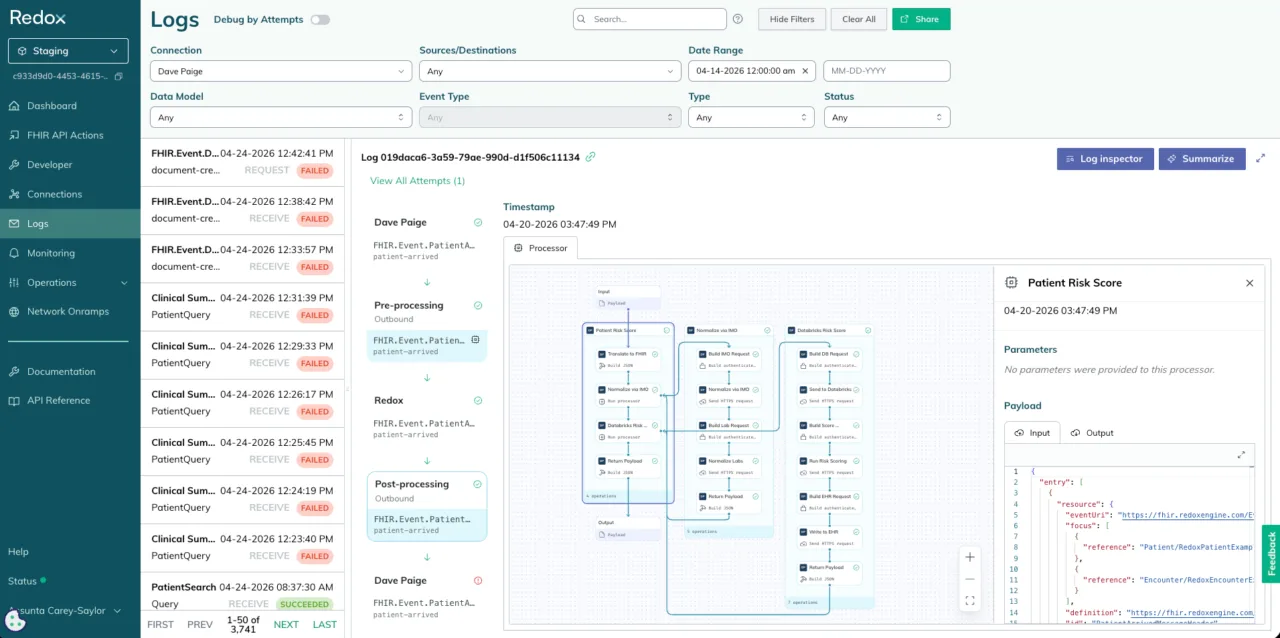
Figure 2. Example of a workflow that ingests data from the EHR, normalizes data via IMO Health, bundles data into a single payload, sends to Databricks for analytics, and writes results back into the EHR for clinical use.
Designed for how people actually troubleshoot
When something breaks, most people start at the output and work backwards, jumping between systems to reconstruct what happened.
Workflow Viewer is built for that reality. You can start at any point in the flow and trace execution in reverse, following a message step by step until you find the failure. Relationships between steps stay explicit, including branching paths like batch splits where one input produces many downstream messages. Instead of manually reconstructing those connections, you can see exactly how each child message relates back to the original input and how every path was processed.
For deeper inspection, Debugger Mode in Log Inspector lets you drill into individual operations and inspect full payload details while overlaying color-coded success and failure states across the workflow. Failing nodes become immediately visible, making it easier to validate data and isolate the root cause.
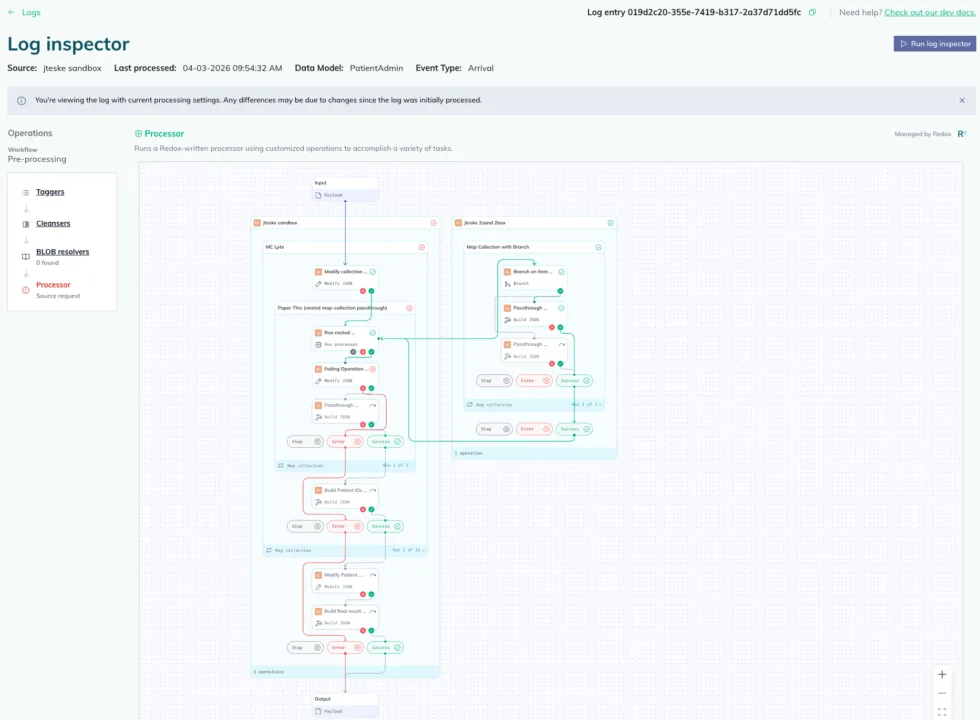
Figure 3. “Debugger Mode” in Log Inspector with more detailed features for troubleshooting integrations.
Easier to share, easier to align
One of the most common requests we heard during customer research last year was surprisingly simple: “I want to be able to show this to someone else.”
Text-based logs are difficult to communicate across teams. Workflow diagrams are not. By visualizing executed integration logic, engineers, product managers, and non-technical stakeholders can all work from the same representation of what happened.
Different situations require different levels of detail. Sometimes you need a high-level view of how data moved through a system. Other times, you need to inspect execution step by step.
Workflow Viewer supports both. Complex logic can be collapsed to simplify the flow or expanded to reveal detailed execution paths and payload-level behavior. Teams can move between overview and inspection without reconstructing context, making troubleshooting and cross-functional collaboration significantly easier.
Why this matters now
Modern integrations are no longer linear pipelines. They are dynamic systems with branching logic, reusable components, and multi-hop journeys and a static, text-based interface is no longer enough to represent that complexity.
At the same time, the audience for integration tooling is expanding. It’s no longer just engineers. Product, operations, and business teams all need visibility into how data flows and a visual-first approach makes that possible.
Raising the bar for integration tooling
Too many teams still accept fragmented logs, limited visibility, and manual troubleshooting as the cost of managing integrations. When issues arise, teams are often forced to stitch together multiple views and manually reconstruct execution paths.
We think there’s a better way.
Workflow viewer is part of a broader shift toward a more intuitive experience across the Redox Engine platform. Instead of treating workflows as disconnected logs, it presents integrations as connected systems that can be explored, inspected, and understood in context.
Workflow viewer is available today for Redox customers using orchestration tooling.
If your team is still debugging integrations by piecing together logs across multiple screens, Redox offers a fundamentally different way to understand what happened and why.